Measurement uncertainty in manufacturing: Understanding the basics
Why precise measurement results alone are not enough
Measurements are indispensable for quality assurance in manufacturing. However, every measurement result is subject to uncertainty. The following article explains key terms in measurement technology and uses an example to show how measurement uncertainties can be systematically determined and evaluated.
Metrology, or the science and application of measurement, is a value-added process in manufacturing environments. Using geometric measurement systems, such as coordinate measuring machines and structured light scanners, for example, we determine if component dimensions meet design tolerances. Similarly, we use optical and stylus surface measurement systems to confirm that the surface roughness meets design requirements for assembly and function. While these instruments can provide accurate results, there is always uncertainty associated with a measurement result. As stated in the ISO Guide to the Expression of Uncertainty in Measurement, it is our responsibility to report not only the measurement result, but also a “quantitative indication of the quality of the result”, or uncertainty [1].
A good starting point for implementing this guidance is a review of common metrology terms and definitions [2].
- The accuracy (of a measurement) is the closeness of agreement between the result of a measurement and the (true) value. It’s important to note that accuracy is a qualitative concept. In other words, numbers should not be associated with it. Numbers should be associated with measures of uncertainty instead.
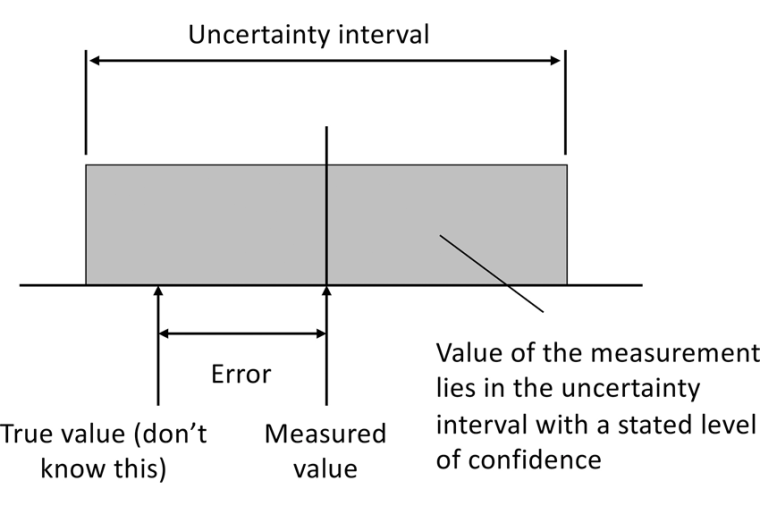
- The error (of measurement) is the result of a measurement minus the (true) value. Because the true value cannot be determined, in practice a “conventional true value” is sometimes used.
- The uncertainty (of a measurement) is a parameter that characterizes the dispersion of the values that could reasonably be attributed to the measurement result. Uncertainty can be quantified using statistical methods or from assumed probability distributions based on experience or other information.
- Resolution is the minimum detectable quantity.
- Repeatability (of results of a measurement) is the closeness of agreement between the results of successive measurements of the same parameter carried out under the same conditions of measurement (i.e., the same procedure, operator, instrument, and location over a short time). Precision has the same meaning as repeatability; it should not be used interchangeably with accuracy.
- Reproducibility (of results of a measurement) is the closeness of agreement between the results of measurements of the same parameter carried out under changed conditions of measurement, such as a new operator.
The relationships between the measured value, true value, error, and uncertainty are shown graphically. It is seen that the value of the measurement lies in the uncertainty interval with a stated level of confidence. When we describe the measurement uncertainty, we are estimating the standard deviation that we’d expect from that measurement carried out using the selected measurement device under the specified conditions.
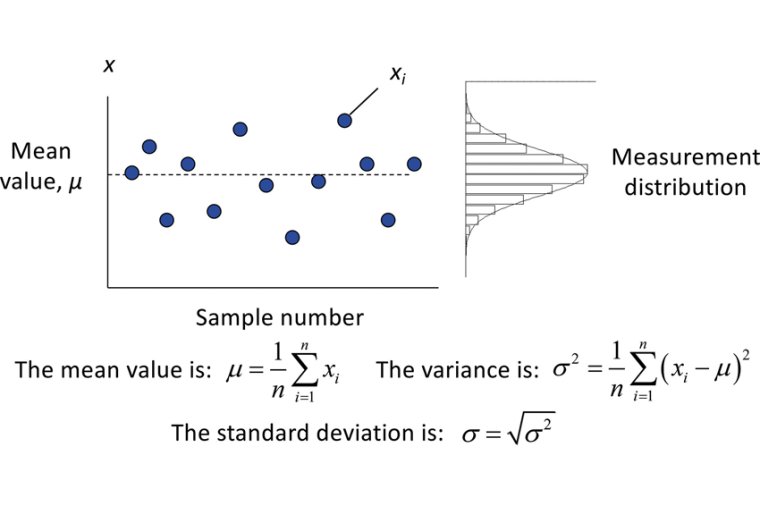
Statistics can be used to characterize the expected scatter for n measurements of a quantity x. The relationships between the samples, xi, mean value, µ, and the distribution in the samples are again depicted graphically. A normal distribution is shown. The equations for the mean value, variance, and standard deviation are also provided.
Measurements with Multiple Variables: Density of an Aluminum Block
Some measurements are based on multiple inputs. In this case, we want to determine the combined effects of the individual inputs on the uncertainty in the measurement result. For example, consider that we wanted to determine the density, µ, of an aluminum block. We would need both the mass, m, and volume, V, of the block. If we calculate the volume from measurements of the three side lengths, L1, L2, and L3, this gives four inputs to the density calculation.
The combined standard uncertainty in the density, uc(µ), depends on the uncertainty in the mass measurement and the three length measurements. It is determined using a first-order Taylor series expansion of the density equation.
The combined standard uncertainty
The combined standard uncertainty equation is composed of four separate terms, where each one is the product of the square of the partial derivative (sensitivity) and the square of the measurement uncertainty (or variance) for each input. The partial derivatives are calculated from the mean values of the inputs. The measurement uncertainties for the inputs can be determined from the standard deviation of repeated measurements (Type A evaluation) or can be based on other information, such as a value provided by the manufacturer (Type B evaluation).
The four separate terms can be compared to determine which input has the largest effect on the combined standard uncertainty. If the combined standard uncertainty is larger than desired, the largest term can be used to determine where to invest in improved measurement devices. For the density example, if the first term in the combined standard uncertainty equation is the largest, then it would make sense to purchase a scale with reduced measurement uncertainty.
References
1. IS, C.I. and AS, M., 1993. Guide to the Expression of Uncertainty in Measurement. The International Organization for Standardization ISO.
2. Taylor, B.N and Kuyatt, C.E., 1994. Guidelines for Evaluating and Expressing the Uncertainty of NIST Measurement Results
Author
Tony Schmitz, Professor University Tennessee
Company
University of Tennessee1 Bethel Valley Rd.
TN 37831-6 Oak Ridge
Germany


most read
The Rise of Photonic and Neuromorphic Computing: A New Era for AI Hardware
Computer Architectures for future data processing

Protective Windows: Finding a Germanium Alternative for LWIR Imaging
In this interview, Mike Giznik, President of Midopt, explains why Silwir is a good choice for applications such as industrial inspection, defense, and autonomous systems.
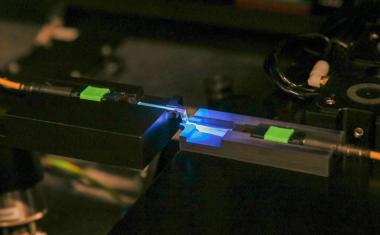
Active Alignment in Assembly and Connection Technology
Reliable manufacturing processes are essential for the assembly and connection technology of photonics systems. Common coupling methods of Active Alignment during assembly are described here.

It Does Not Always Have to Be a Humanoid Robot
Mythomorphic design adds a distinct perspective to social robotics. Inspired by myths and fantasy rather than humans or animals, the article classifies examples and examines related opportunities and risks.
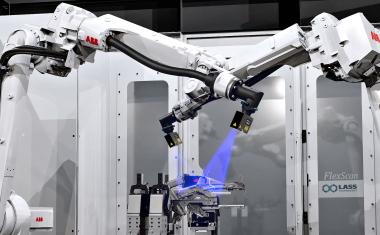
3D laser scanning for 100 percent inspection
Modern production requires precise, fast, and fully automated inspection processes. The robot-assisted inline measurement system Flexscan meets this requirement with two 3D compact sensors